What is the DCMA 14-Point Assessment?
The DCMA 14-Point Assessment is a set of schedule quality checks originally developed by the US Defense Contract Management Agency. It has become a common benchmark well beyond defence — owners, contractors and project controls teams in construction, infrastructure and energy use it to judge whether a schedule is logically sound and credible before relying on it.
Each check looks at one aspect of schedule health, such as missing logic, excessive float or unrealistic durations, and compares the result against a threshold.
The 14 checks
| # | Check | What it looks at | Common threshold |
|---|---|---|---|
| 1 | Logic | Incomplete activities missing a predecessor or successor | ≤ 5% |
| 2 | Leads | Relationships with a negative lag | 0% |
| 3 | Lags | Relationships with a positive lag | ≤ 5% |
| 4 | Relationship types | Share of finish-to-start relationships | ≥ 90% FS |
| 5 | Hard constraints | Activities with hard date constraints | ≤ 5% |
| 6 | High float | Total float over 44 working days | ≤ 5% |
| 7 | Negative float | Total float below zero | 0% |
| 8 | High duration | Remaining duration over 44 working days | ≤ 5% |
| 9 | Invalid dates | Forecasts before, or actuals after, the data date | 0% |
| 10 | Resources | Activities with duration but no resources or cost | Reported |
| 11 | Missed tasks | Activities that finished later than their baseline | ≤ 5% |
| 12 | Critical path test | Whether a delay on the critical path moves the finish | Pass / fail |
| 13 | CPLI | Critical Path Length Index | ≥ 0.95 |
| 14 | BEI | Baseline Execution Index | ≥ 0.95 |
These are the thresholds most commonly used. In GanttSnap every threshold can be adjusted to match your contract or company standard.
How to run a DCMA assessment in PowerPoint
-
Import your Primavera P6 schedule
Load the XER file into GanttSnap in PowerPoint.
-
Set your thresholds
Use the standard values or open Customize to set your own for any check.
-
Run the analysis
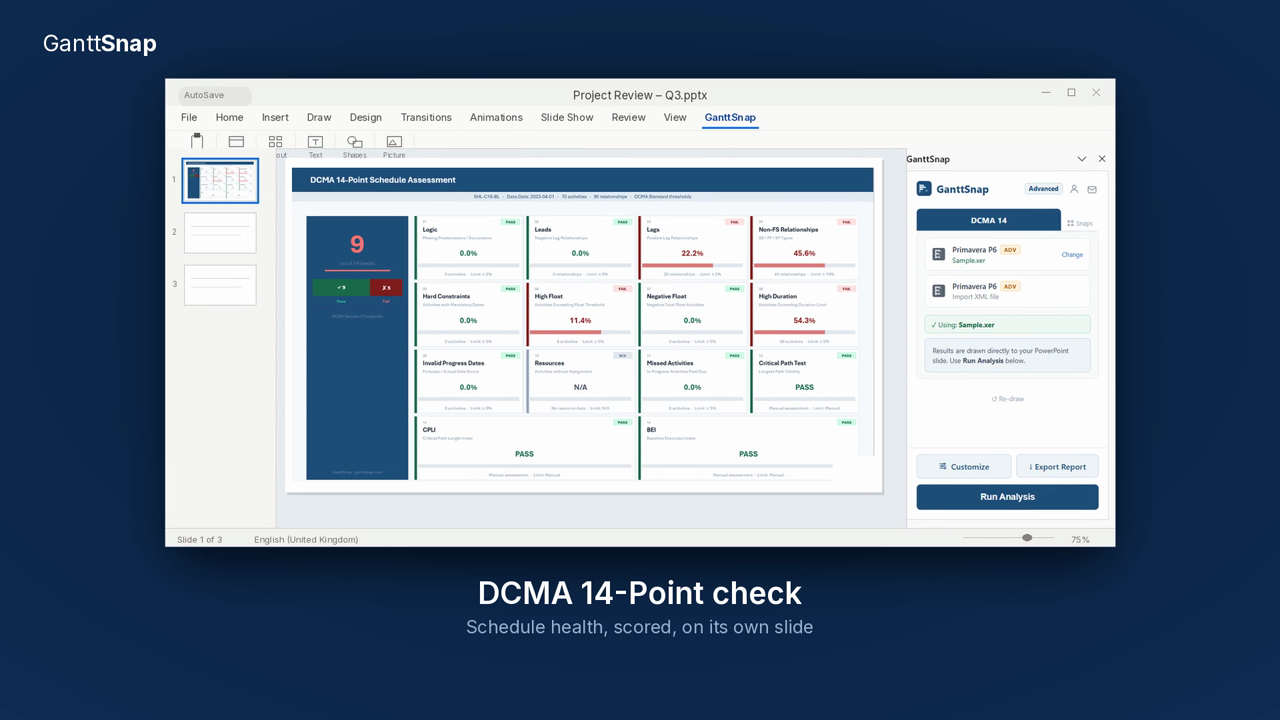
GanttSnap scores all 14 checks and lays the result out as a dashboard slide — overall score, each check's value and a clear pass/fail indicator.
-
Export the Excel report
Every run comes with a detailed Excel report, so the scheduler can work through the findings behind each check.
From schedule check to management slide
Most schedule-checking tools stop at a report for the scheduler. GanttSnap puts the result where the conversation happens: on a slide in the project review deck, next to the Gantt chart it describes. The Excel report keeps the detail for the people who need to fix things; the dashboard gives everyone else the answer in one look.
Frequently asked questions
Can I change the DCMA thresholds?
Yes. Every threshold can be customised before you run the analysis, so the assessment matches your contract or company standard.
Is the Excel report included every time?
Yes. Each run produces the dashboard slide and a detailed Excel report.
Is my schedule uploaded anywhere?
No. The XER file is read and analysed inside the add-in on your own machine; your schedule data is not sent to GanttSnap's servers.
How much does it cost?
The DCMA 14-Point Assessment is part of the Advanced plan at €59 per year, together with Primavera P6 and MS Project import, critical path and baseline comparison.